
January's Turo Insights in Las Vegas, NV USA
Data covers listings 15 miles around Las Vegas, NV USA

Let's talk data!
Welcome to TurboPricing.com, your go-to resource for insights into the Turo car-sharing marketplace.
In this blog post, we will delve into data specifically from Las Vegas, NV, covering a range of fascinating topics.
Map of average prices of listings
5 most common car models
5 least common car models
Recent price and availability trends
Listings by the model year
Number of available listings by type of the models
Some cars never rented
Get ready to explore these insights that can help you optimize your Turo listings!
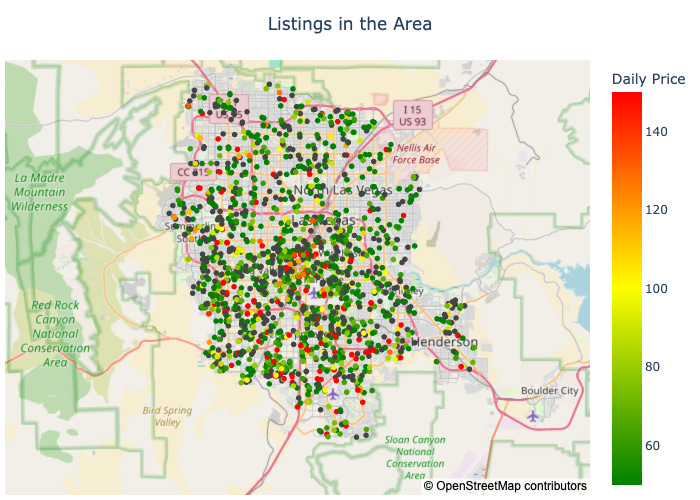
Map of Average Prices of Listings
Understanding the average prices of Turo listings in various regions is crucial for optimizing your rental strategy.
By analyzing a map of average prices, you can identify competitive pricing in your area and adjust your rates accordingly.
This data can help you pinpoint high-demand locations where you might want to increase your fleet or adjust your pricing strategy.
Additionally, being aware of seasonal fluctuations in pricing can allow you to maximize your earnings during peak travel times.
Utilize this information to position your listings effectively and attract more renters.
5 most common car models
Understanding the most common car models on Turo can help hosts make informed decisions about their listings. Here are the top five models currently dominating the platform, along with their availability and new bookings.
Tesla Model 3 (2017 - 2025): 193 available listings, 294 new bookings
Ford Mustang (1965 - 2024): 160 available listings, 446 new bookings
Tesla Model Y (2020 - 2025): 136 available listings, 152 new bookings
Chevrolet Corvette (1974 - 2025): 93 available listings, 218 new bookings
Toyota Corolla (2012 - 2025): 89 available listings, 164 new bookings
These models not only have high availability but also attract significant interest from renters, making them excellent choices for Turo hosts.
5 Least Common Car Models
In the Turo marketplace, certain car models are significantly less common than others. Here are the five least available models, along with their respective number of listings and new bookings.
Subaru Solterra (2024) - 1 listing, 0 new bookings
Honda Accord Sedan (2023) - 1 listing, 8 new bookings
Chevrolet Bolt EV (2020) - 1 listing, 0 new bookings
Chevrolet Bolt EUV (2023) - 1 listing, 1 new booking
Maserati Grecale (2023) - 1 listing, 0 new bookings
Recent Price and Availability Trends
In January 2025, Turo hosts experienced notable fluctuations in pricing and availability. The data reveals that the median price (P50) started at $67.00 and gradually decreased to $55.00 by the end of the month, indicating a downward trend in rental prices. Meanwhile, the mean price hovered around $87.02 at the beginning and dropped to $76.44 by January 31st.
The volume of rentals also showed an upward trajectory, starting at 2,257 on January 1st and peaking at 3,237 by January 27th. This suggests that while prices were declining, demand was increasing, likely due to seasonal factors or promotional activities. The P90 price, which indicates the higher end of the pricing spectrum, fluctuated between $120 and $149, providing insight into the premium listings available.
Overall, hosts should consider adjusting their pricing strategies in response to these trends. With increasing rental volumes, there may be opportunities to optimize pricing without sacrificing occupancy rates. Monitoring these metrics closely can help hosts maximize their earnings while remaining competitive in the marketplace.

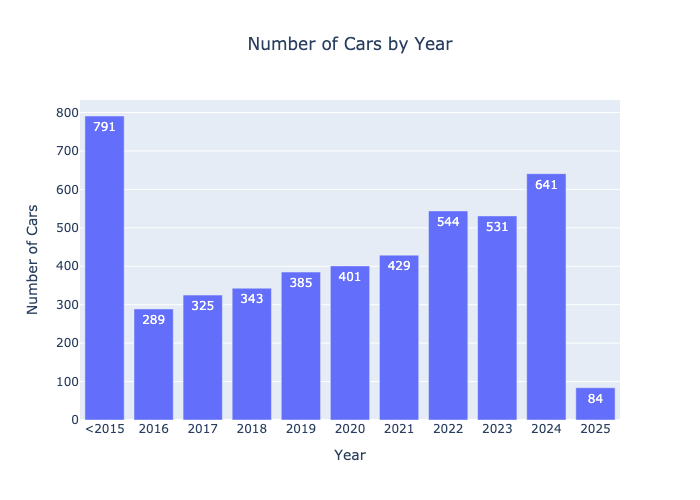
Listings by the model year
Analyzing the available Turo listings by model year reveals interesting trends in vehicle availability. Listings for models made in 2015 or older total 791, indicating a significant number of older vehicles still in circulation. However, newer models are increasingly dominating the market, with the year 2024 showing the highest count at 641 listings. The years 2022 and 2023 also demonstrate strong availability with 544 and 531 listings, respectively. This suggests a growing preference for newer vehicles among hosts, likely driven by demand for modern features and improved reliability.
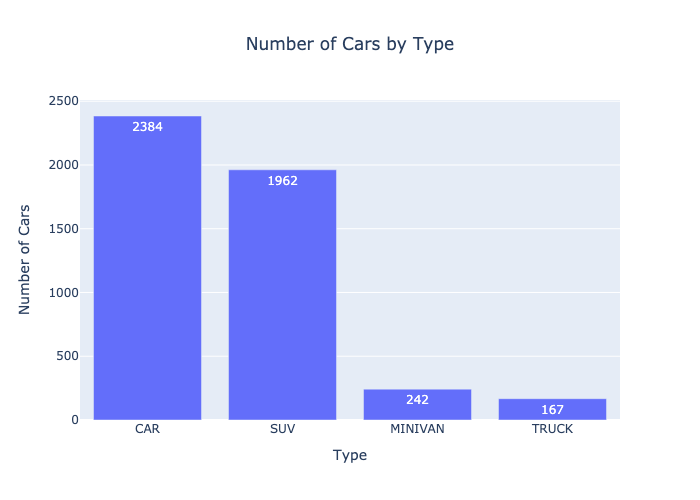
Number of Available Listings by Type of the Models
In the Turo marketplace, the distribution of available listings by vehicle type reveals interesting trends. Currently, there are 2,384 cars, making them the most prevalent option for renters. SUVs follow closely with 1,962 listings, indicating a strong demand for larger vehicles. Minivans and trucks are less common, with only 242 and 167 listings, respectively. This data highlights the popularity of standard cars and SUVs, which could guide hosts in selecting vehicle types that align with market demand.
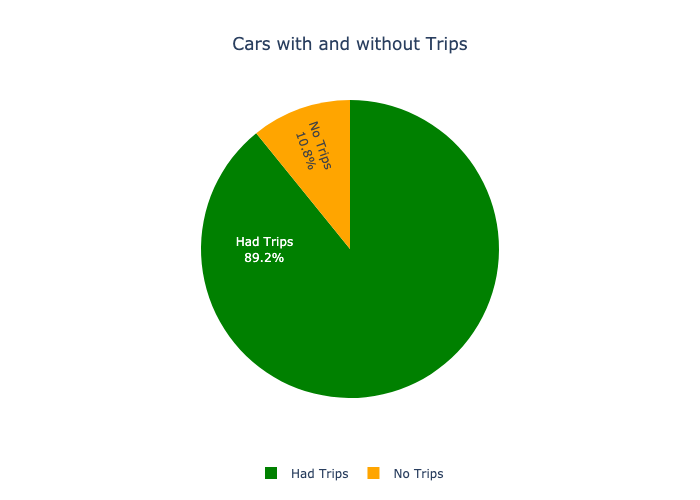
Some Cars Never Rented
In analyzing the rental data, we observe a significant disparity between cars that have been rented and those that have not. Out of a total of 4,763 listings, 4,247 cars had successful trips, while 516 cars remained unrented. This indicates that a notable percentage of vehicles are not attracting bookings, highlighting the importance of optimizing listings to enhance visibility and appeal.
Conclusion
In summary, optimizing your Turo listing requires a keen understanding of market trends, competitive pricing, and effective marketing strategies.
By leveraging the insights shared in this blog post, you can enhance your visibility, attract more renters, and ultimately maximize your earnings.
For more data and tailored insights specific to your city, we invite you to visit TurboPricing.com. Stay ahead in the Turo marketplace!