
January's Turo Insights in Los Angeles, CA
Data covers listings 15 miles around Los Angeles, CA USA

Let's talk data!
Welcome to TurboPricing.com, your go-to source for valuable insights into the Turo car-sharing marketplace.
In this blog post, we will dive into data specifically from Los Angeles, CA, covering a range of topics that will help you optimize your Turo listings.
Map of average prices of listings
5 most common car models
5 least common car models
Prices and available listings in Los Angeles, CA
Listings by the model year
Number of available listings by type of the models
Some cars never rented
Stay tuned as we explore these insights to help you maximize your earnings and enhance your Turo experience.
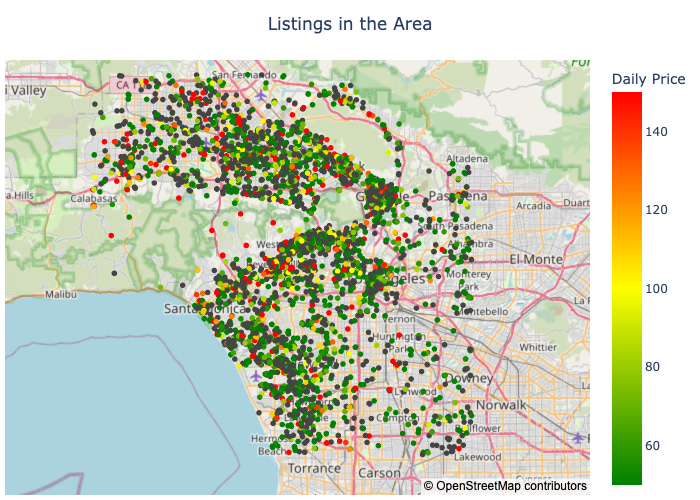
Map of Average Prices of Listings
Understanding the average prices of Turo listings across different regions is crucial for setting competitive rates.
A well-structured map can visually represent these average prices, helping hosts identify where they can maximize their earnings.
For instance, urban areas typically show higher average prices due to increased demand, while rural locations may offer lower rates.
By analyzing this data, hosts can adjust their pricing strategies to align with market trends.
Additionally, keeping an eye on seasonal fluctuations can help hosts optimize their listings throughout the year.
Incorporating this map into your strategy can lead to better pricing decisions and ultimately higher profits.
5 most common car models
Understanding the most popular car models on Turo can help hosts optimize their listings and attract more bookings. Here are the five most common car models currently available, along with their number of listings and total new bookings.
Tesla Model 3 (2018 - 2025): 345 listings, 326 new bookings
Tesla Model Y (2020 - 2025): 309 listings, 206 new bookings
Kia Forte (2014 - 2024): 272 listings, 398 new bookings
Mercedes-Benz C-Class (2011 - 2025): 204 listings, 163 new bookings
Ford Mustang (1966 - 2025): 196 listings, 220 new bookings
By focusing on these popular models, hosts can enhance their chances of securing more rentals and maximizing their earnings.
5 Least Common Car Models
In the Turo marketplace, certain car models are quite rare, with only a handful of listings available. Here are the five least common car models currently on the platform, each with just one listing and no new bookings recorded.
AMC Ambassador (1968) - 1 listing, 0 new bookings
Chevrolet Chevelle (1971) - 1 listing, 0 new bookings
Chevrolet Colorado (2022) - 1 listing, 0 new bookings
Pontiac Firebird (1968) - 1 listing, 0 new bookings
Pontiac Bonneville (1972) - 1 listing, 0 new bookings
These models may appeal to niche markets, but their rarity suggests limited demand.
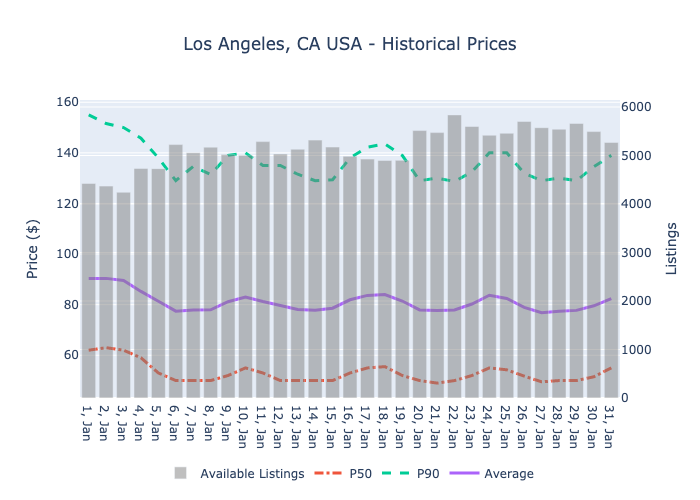
Recent Price and Availability Trends
In January 2025, the car rental market in Los Angeles showcased a dynamic range of pricing and availability. The average daily rental price (mean) fluctuated around $90.33, with a median price (P50) of $62.00 and a 90th percentile price (P90) reaching $155.00. The total volume of listings varied significantly, peaking at 5,837 listings on January 22.
Analyzing the data reveals several trends. Initially, prices started strong at the beginning of the month, with a mean of $90.33 on January 1. However, a downward trend in pricing was observed, with the mean dropping to $76.80 by January 27. This decline coincided with an increase in listing volume, suggesting that more hosts entered the market, leading to increased competition and lower prices.
Interestingly, while the mean price decreased, the P90 price remained relatively stable, indicating that premium listings still commanded higher rates. The highest P90 price recorded was $155.00 on January 1, gradually decreasing but still reflecting a strong market for higher-end vehicles.
Overall, Turo hosts in Los Angeles should consider adjusting their pricing strategies in response to these trends. As the volume of listings increases, competitive pricing will be crucial to attract renters while still maximizing earnings.
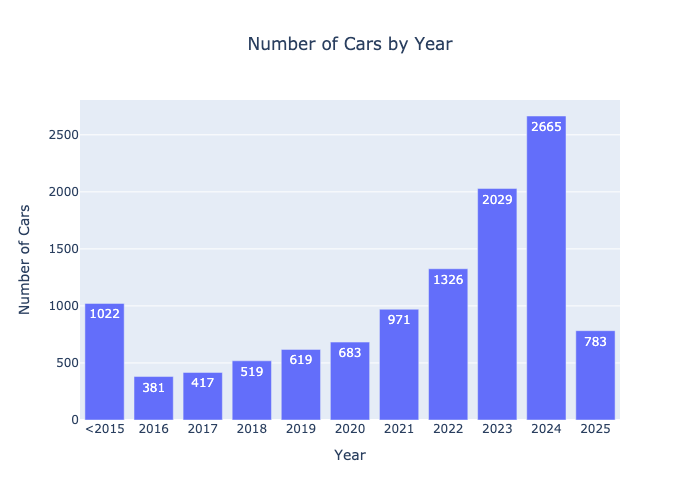
Listings by the Model Year
Analyzing the available Turo listings by model year reveals a clear trend towards newer vehicles. The data shows that models from 2015 or older account for 1,022 listings, while the number of listings increases significantly for newer models. Notably, the year 2024 leads with 2,665 listings, followed closely by 2023 with 2,029. This indicates a growing preference for newer vehicles among hosts, likely driven by demand for modern features and improved reliability.
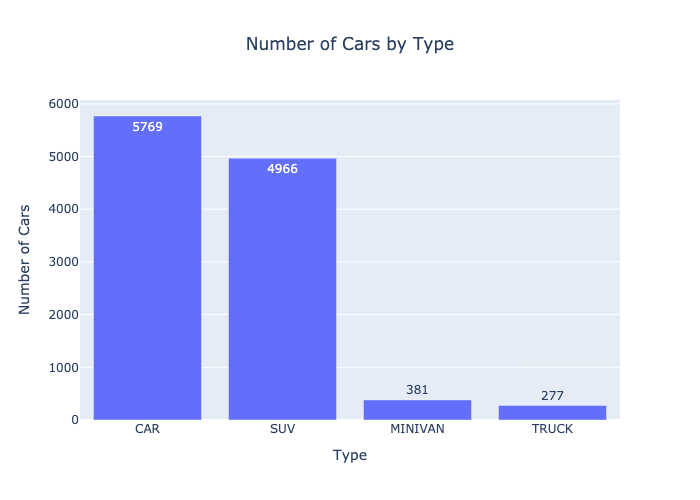
Number of Available Listings by Type of the Models
In the current Turo marketplace, the distribution of available listings by vehicle type reveals interesting trends. Cars dominate the platform with a total of 5,769 listings, followed by SUVs with 4,966 options. Minivans and trucks are significantly less common, with only 381 and 277 listings, respectively. This data highlights the popularity of standard cars and SUVs among renters, suggesting that hosts with these vehicle types may have a competitive advantage.
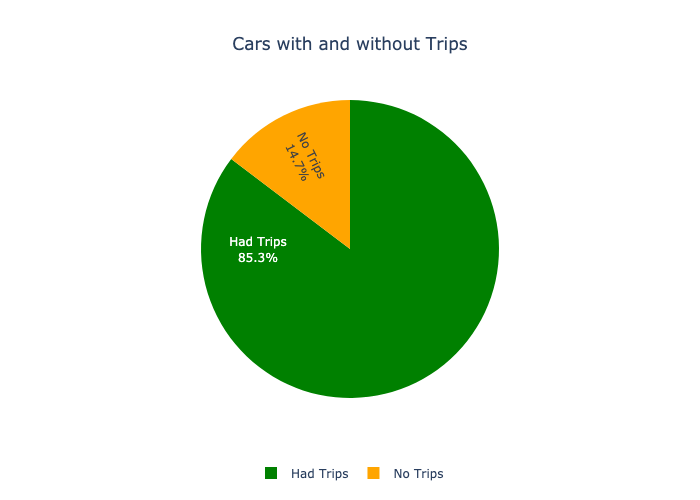
Some Cars Never Rented
The data reveals a significant disparity in rental activity among Turo listings. Out of a total of 11,415 cars, 9,739 have successfully completed trips, indicating a robust demand for certain vehicles. However, 1,676 cars remain unrented, highlighting that not all listings attract interest. This suggests that hosts should carefully consider their vehicle choices and listing strategies to enhance visibility and appeal.
Conclusion
In conclusion, optimizing your Turo listing is essential for maximizing your earnings and staying competitive in the car rental market.
Key strategies include understanding market trends, pricing your vehicle competitively, and enhancing your listing with high-quality photos and detailed descriptions.
By implementing these tips, you can attract more renters and increase your overall success as a Turo host.
For more data and insights tailored to your city, be sure to visit TurboPricing.com. We're here to help you thrive in the Turo marketplace!