
January's Turo Insights in San Francisco, CA USA
Data covers listings 15 miles around San Francisco, CA USA

Let's talk data!
Welcome to TurboPricing.com, your go-to source for valuable insights into the Turo car-sharing marketplace.
In this blog post, we will delve into data specifically from San Francisco, CA, USA. Here's a quick overview of what we'll cover:
Map of average prices of listings
5 most common car models
5 least common car models
Recent price and availability trends
Listings by the model year
Number of available listings by type of the models
Some cars never rented
Get ready to uncover key insights that can help you optimize your Turo listings and maximize your earnings!
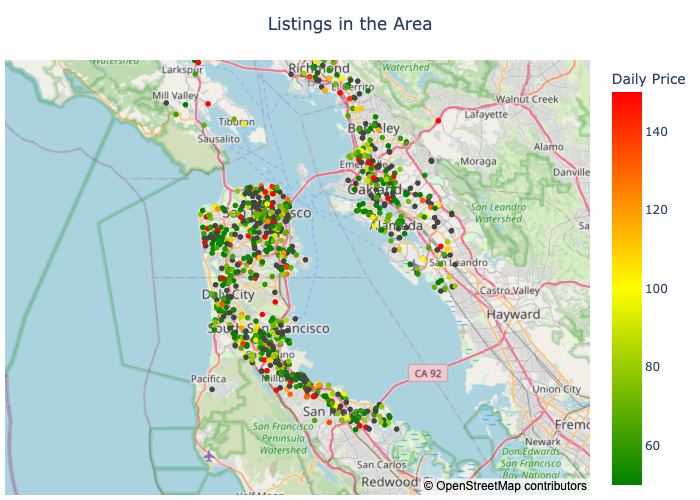
Map of Average Prices of Listings
Understanding the average prices of Turo listings in various regions is crucial for hosts looking to optimize their rental strategies.
By analyzing this map, you can identify pricing trends in your area and adjust your rates accordingly to remain competitive.
For instance, if you notice that listings in your city are priced higher than the average, it may be an opportunity to increase your rates.
Conversely, if prices are lower, consider lowering your rates or enhancing your vehicle's appeal to attract more renters.
Utilizing this pricing map can help you make informed decisions, ensuring you maximize your earnings while providing value to your customers.
5 most common car models
Understanding the most common car models on Turo can help you make informed decisions about your own listings. Here are the top five models currently dominating the platform, along with their availability and booking statistics.
Tesla Model 3 (2017 - 2025): 153 available listings, 233 new bookings
Tesla Model Y (2020 - 2025): 123 available listings, 236 new bookings
Toyota Corolla (2008 - 2025): 55 available listings, 133 new bookings
Toyota Sienna (2012 - 2024): 47 available listings, 57 new bookings
Toyota Prius (2010 - 2024): 44 available listings, 58 new bookings
These models not only have high availability but also show promising booking rates, making them excellent choices for potential hosts.
5 Least Common Car Models
In the Turo marketplace, certain car models are notably rare. Understanding these less common options can help hosts identify unique offerings that may attract niche customers. Here are the five least common car models currently listed on Turo, along with their availability and new bookings:
Hyundai Kona EV (2022) - Available Listings: 1, New Bookings: 0
Mercedes-Benz M-Class (2015) - Available Listings: 1, New Bookings: 1
Chevrolet Traverse (2020) - Available Listings: 1, New Bookings: 3
Mercedes-Benz SL-Class (2023) - Available Listings: 1, New Bookings: 0
Kia EV6 (2023) - Available Listings: 1, New Bookings: 0
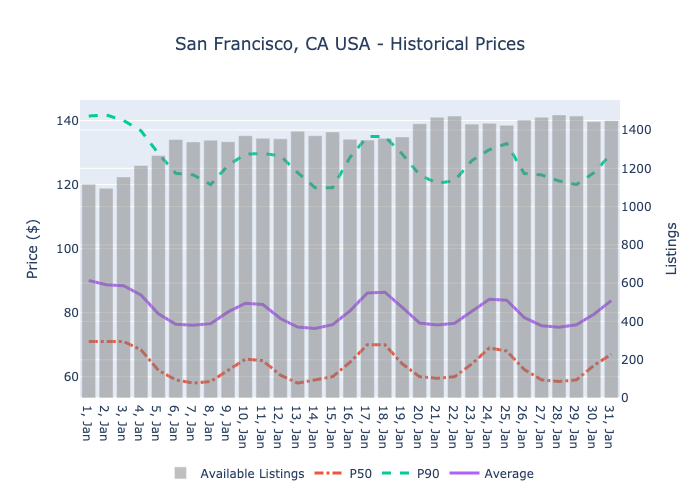
Recent price and availability trends
In January 2025, Turo hosts experienced notable fluctuations in rental prices and availability. The median price (P50) hovered around $65, with a peak at $71 on several days. The mean price averaged approximately $80, while the 90th percentile (P90) reached as high as $141.75, indicating a diverse pricing strategy among hosts.
Analyzing the data, we see a downward trend in both mean and median prices early in the month, with the lowest mean price recorded at $75.05 on January 14. However, as the month progressed, prices began to stabilize, with a slight uptick towards the end, peaking at $83.77 on January 31. This suggests that hosts may have adjusted their pricing strategies in response to market demand.
Volume data reveals a consistent demand, with over 1,100 rentals daily. The highest volume was recorded on January 20, with 1,467 rentals, indicating a strong interest in Turo rentals during this period. Hosts should consider these trends when setting their prices and availability to maximize their earnings.
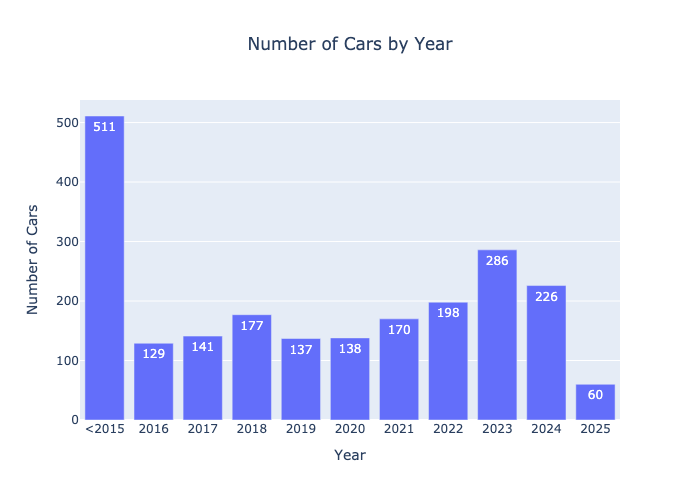
Listings by the model year
Analyzing the data on available Turo listings by model year reveals interesting trends. The largest segment comes from vehicles made in 2015 or older, with 511 listings. However, newer models are gaining traction, particularly the 2023 models, which have 286 listings, and 2024 models with 226. The years 2021 and 2022 also show strong numbers at 170 and 198 listings, respectively. This indicates a growing preference for newer vehicles among renters, while older models are gradually declining in availability.
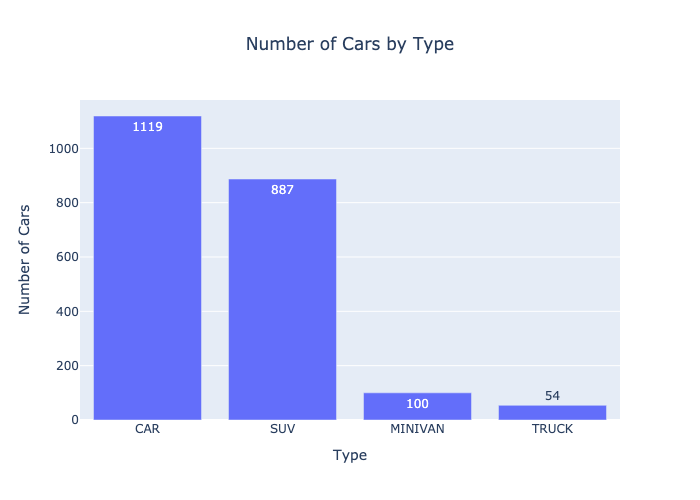
Number of Available Listings by Type of the Models
In the current Turo marketplace, the distribution of available listings by vehicle type reveals interesting trends. Cars dominate the listings with a total of 1,119, followed by SUVs at 887. Minivans and trucks have fewer listings, with 100 and 54 respectively. This data indicates a strong preference for standard cars and SUVs among renters, highlighting an opportunity for hosts to focus on these popular categories.
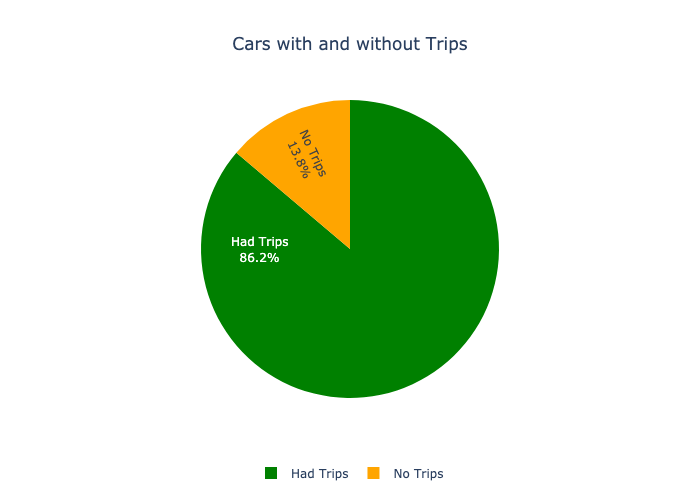
Some Cars Never Rented
The data reveals a significant disparity in rental activity among Turo listings. Out of a total of 2,173 cars, 1,873 have successfully completed trips, indicating a healthy demand for these vehicles. However, 300 cars have never been rented, highlighting the importance of optimizing listings to attract potential renters. This suggests that certain factors, such as pricing, vehicle type, or marketing strategies, may need to be reevaluated to enhance visibility and appeal.
Conclusion
In summary, optimizing your Turo listing involves understanding market trends, pricing strategies, and the importance of vehicle presentation.
By leveraging the insights shared in this blog post, you can enhance your rental performance and maximize your earnings.
For more detailed data and insights tailored to your city, we invite you to visit TurboPricing.com.
Stay informed and ahead of the competition in the dynamic world of car rentals!